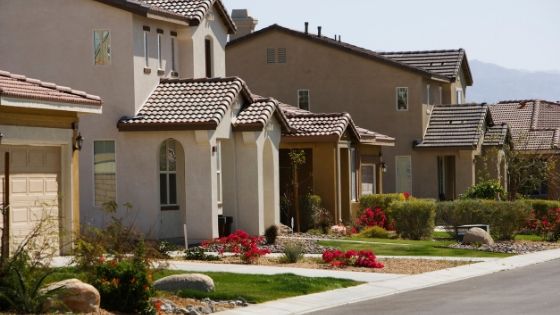
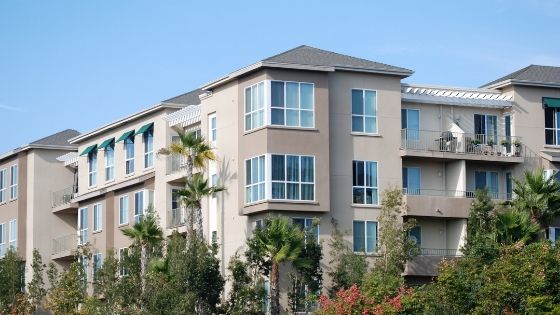
The Chris Eckert Real Estate Team keeps you up to date with monthly market reports. Find out more about the San Mateo County real estate market in this report.
If you are planning to buy, you can search for homes in your price range with our home search tool. Make sure to sign up to be notified as soon as matching properties become available. Then give us a call so we can help you find the perfect home.
If you are thinking of selling, utilize our free home valuation tool to get an idea of your home’s worth. Then give us a call and we can answer all your questions about listing your home.
San Mateo County Area Housing Market Statistics For May 2019

San Mateo Housing Stats
The average list price for single-family homes in San Mateo for May 2019 was $1,711,387, and the average sale price was $1,812,011.
Homes for sale in San Mateo spent an average of 22 days on the market before being sold, there were 64 homes sold within 30 days of being listed.
For May 2019 there were 78 new listings, 47 active listings, 47 pending listings, and 11 listings had price reductions. The list price to sale price ratio was 105.88% for May 2019.
Burlingame Housing Stats
In Burlingame, the average list price for single-family homes is $2,725,050 and the average sale price $2,809,669.
Homes were on the market for an average of 33 days before being sold.
During May 2019, 22 new listings hit the market, there were 18 active listings, 18 pending listings, and 20 properties were sold within 30 days.
Seller’s list price to sale price ratio was 103.11%
Hillsborough Housing Stats
Single-family homes in Hillsborough had an average list price $6,288,000 and average sale price of $5,998,000.
The average number of days on the market for homes in Hillsborough was 87. There were 11 homes that sold within 30 days.
There were 24 new listings for May 2019, and 39 active listings. A total of 17 listings were pending in May 2019. Seller’s list price to sales price ratio was 44.68%
Foster City Housing Stats
In Foster City, during May 2019 the average list price for single-family homes was $1,838,726 and the average sale price was $1,901,567.
Homes averaged 17 days on market and 15 homes sold within 30 days.
There were 18 new listings on the market, a total of 11 active listings, and 8 listings were pending. The list price to sale price ratio was 103.42% for May 2019.
Belmont Housing Stats
The Belmont single-family home average list price for May 2019 was $1,930,211 and the average sale price is $2,034,107.
Homes spent an average of 22 days on market before being sold, and there were 14 homes sold within 30 days.
In Belmont 21 new listings came to market during May 2019, there were 16 active listings, 13 pending listings, and the list price to sales price ratio was 105.38%
San Carlos Housing Stats
The San Carlos single-family home average list price is $2,181,793, and the average sale price is $2,328,672 for May 2019.
Homes spent an average of 20 days on the market, and 27 homes were sold within 30 days.
There were 29 new listings that hit the market, a total of 22 active listings during May 2019, and 19 listings were pending. The list price to sales price ratio was 106.73%
Redwood City Housing Stats
The average list price for homes in Redwood City for May 2019 was $1,773,473 and the average sale price was $1,823,970.
The average number of days on the market for homes was 33, and 58 homes sold within 30 days.
There 85 new listings that came to market in Redwood City, there were 80 active listings, 46 pending listings, and one short sale. The list price to sales price ratio was 102.85%
Redwood Shores Housing Stats
The Redwood Shores average list price for single-family homes was $2,088,000 and the average sale price was $2,273,900.
The average number of days on the market for May 2019 was 38, and two homes were sold within 30 days.
There was a total of 7 new listings on the market, a total of 7 active listings, and 3 listings were pending. The list price to sale price ratio was 108.90%
San Mateo County Area Condo Market Statistics For May 2019

San Mateo Condo Stats
Condos in San Mateo had an average list price of $890,159 and an average sale price of $940,133 for May 2019.
Condos averaged 28 days on the market, and 30 listings were sold within 30 days.
There were a total of 47 new listings, 45 active listings, and 22 listings were pending. Seller’s list price to sale price ratio was 105.61%
Foster City Condo Stats
In Foster City the average list price of condos was $1,113,491 and the average sale price was $1,174,357 for May 2019.
Condos averaged 29 days on the market, and 14 condos sold within 30 days.
There were 24 new listings that came to market, there was a total of 28 active listings, 16 listings were pending, and the list price to sale price ratio was 105.47%
Belmont Condo Stats
Belmont condos averaged a list price of $723,250, and had an average sale price $725,468.
Condos averaged 75 days on the market, and 4 condos were sold within 30 days.
There were two new listings, four active listings, three listings were pending, and four condos were sold within 30 days. The list to sale price ratio for condos in Belmont was 100.31%
San Carlos Condo Stats
The average list price for condos in San Carlos for May 2019 was $1,233,000 and the average sale price was $1,230,911.
The average number of days on the market was 17, and seven listings sold within 30 days.
There were four new listings during May 2019, four active listings, three pending listings, and the list price to sale price ratio was 99.93%.
Redwood City Condo Stats
In Redwood City the condo average list price was $1,292,000, and the average sale price was $1,402,000.
Condos spent an average of 20 days on the market, and five were sold within 30 days.
There were15 new listings to hit the market, 13 active listings, six listings were pending, and the list price to sale price ratio was 108.51%.
What Does This Mean For Buyers In San Mateo County?
Buyers should expect higher prices and a minimum amount of inventory available in most areas.
Buyers should be prepared to act quickly and submit the most competitive offer to not miss out on properties that match their needs.

What Does This Mean For Sellers In San Mateo County?
In most areas sellers can expect to get their asking price or a little higher for their home. It is important to have your home show ready and marketed to the most qualified buyers.
We hope you find this report useful, if you have questions about buying or selling in the San Mateo County real estate market, give the Chris Eckert Team a call. We are happy to answer all of your questions.

See Additional Reports on the San Mateo County Real Estate Market
San Mateo County Homes for Sale
Here are the most recent home listings just added to the database in the median sale price range for San Mateo County. All homes here are priced at $2,622,737 or less.
San Mateo County Condos for Sale
Here are the most recent condominium listings just added to the database in the median sale price range for San Mateo County. All homes here are priced at $1,094,573 or less.


